Profiling the economic and business history of NYC
Analysis
In an effort to explore the data, we elected to conduct several exploratory analyses that we believe to be indicative of the potential contained within the data. These analyses utilized the initially extracted data, and were restricted to the years 1850 – 1879, the decades that had geocoded markers included for each entry.
In order to add depth to the extracted dataset, we tagged each entry with two external markers: predicted gender and predicted ethnicity. These tags enabled us to conduct more interesting analyses, providing deeper insight into the structural and cultural norms surrounding employment in the 19th century.
Tagging Methodology
We used a package in R called gender to tag our entries as “male” or “female”. For data predating 1930, this package encodes gender based on names and dates of birth using U.S. Census data from IPUMS. By using these datasets in place of lists of male and female names, this package is able to more accurately guess the gender of a name; furthermore, it is able to report the proportion of times that a name was male or female for any given range of years. There was quite a preponderance of widows within the data, which we filtered out via a Regular Expression filter to ensure accuracy of occupation.
For the purpose of identifying the ethnicity of names, we used the Python package Ethnicolr. Using first and last name, this package will classify the entry as one of 13 different ethnicities. Of course, the analyses that make use of the ethnicity tags must be viewed under the scrutiny of an historic lens. Indeed, while our probabilistic tagging seemingly worked without issue, we cannot avoid the fact that some tags are necessarily incorrect, due to the fact that we are mapping modern descriptions based on nomenclature norms from over 150 years ago.
Visualizations
Workplace Hotspot Distributions
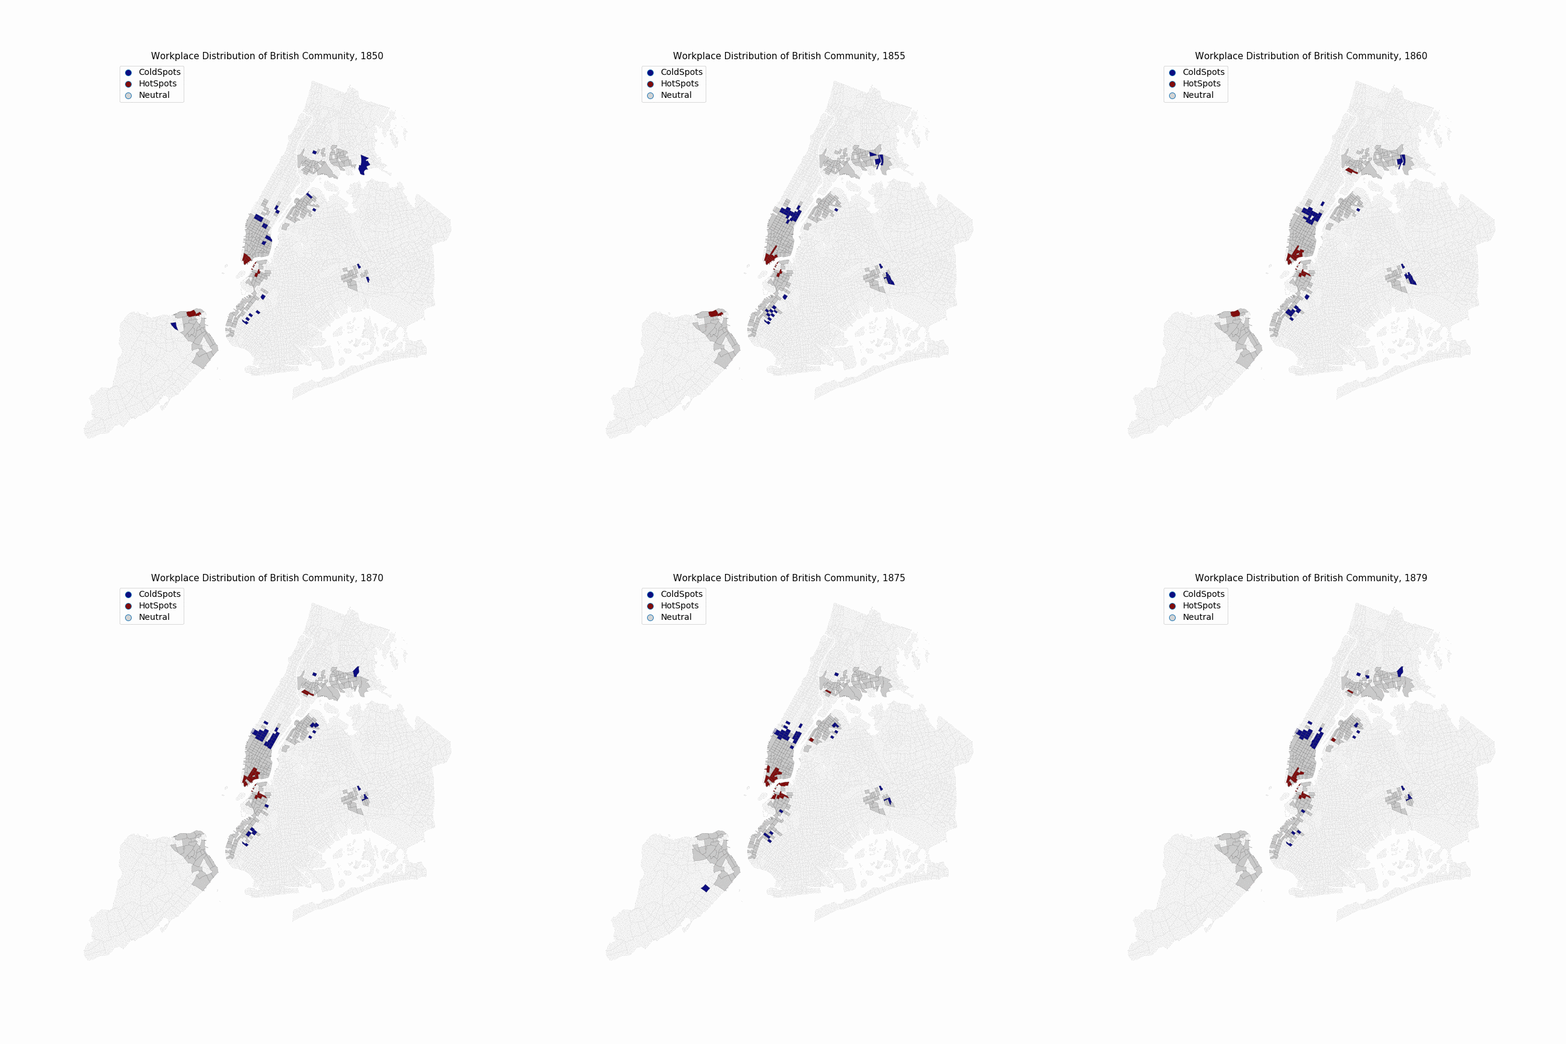
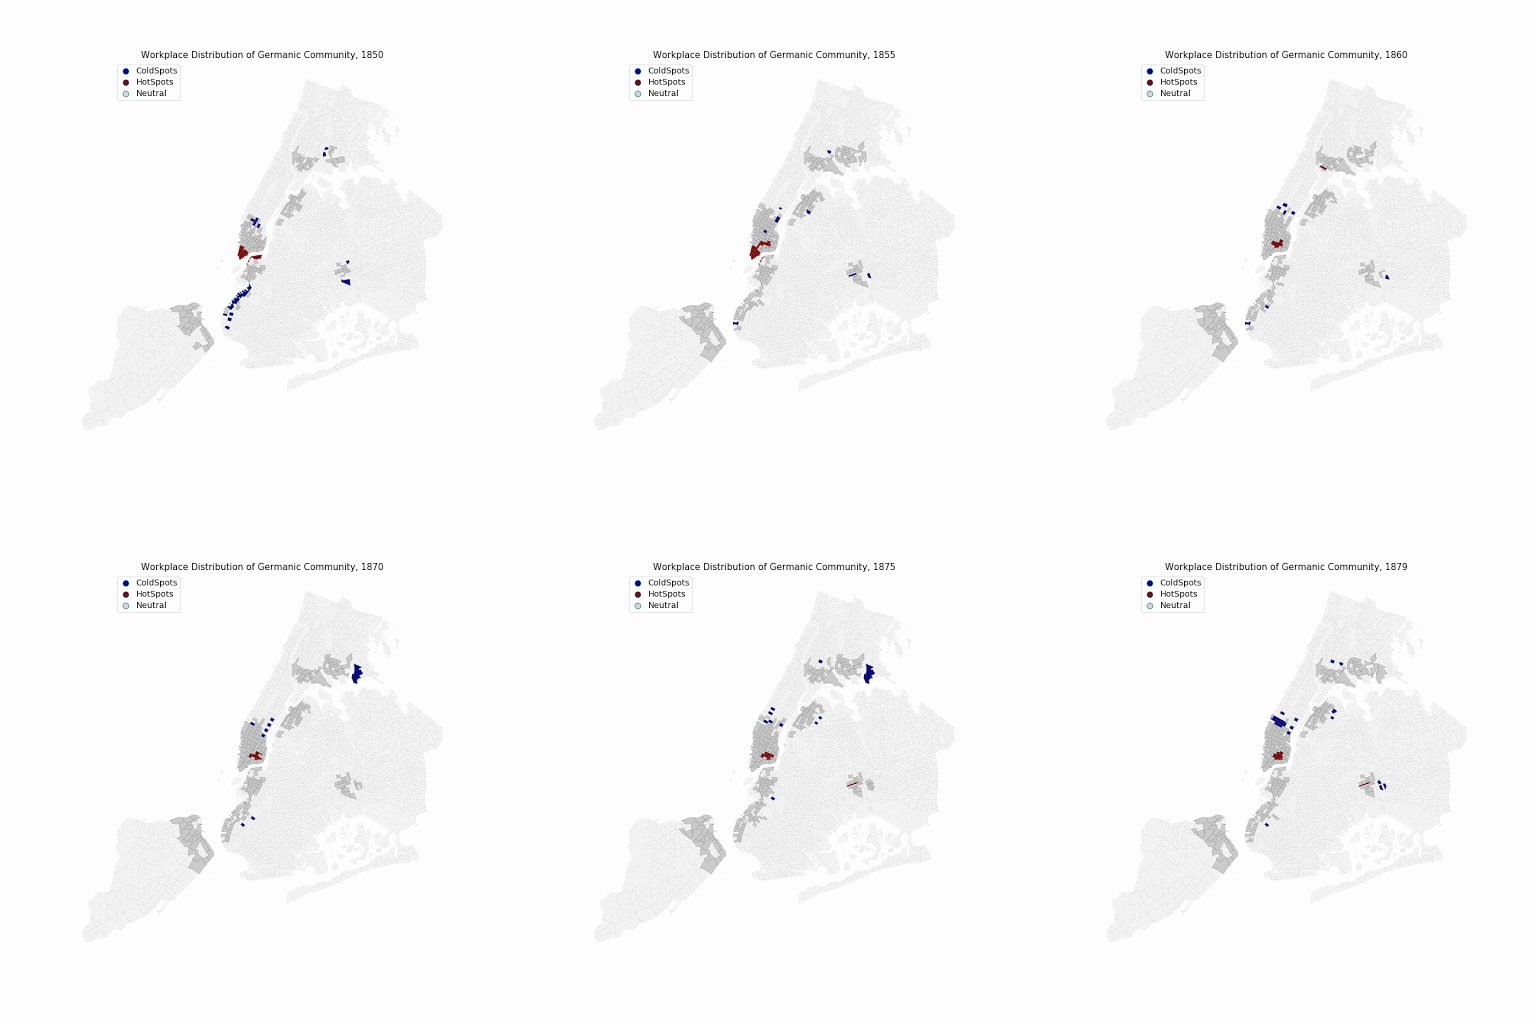
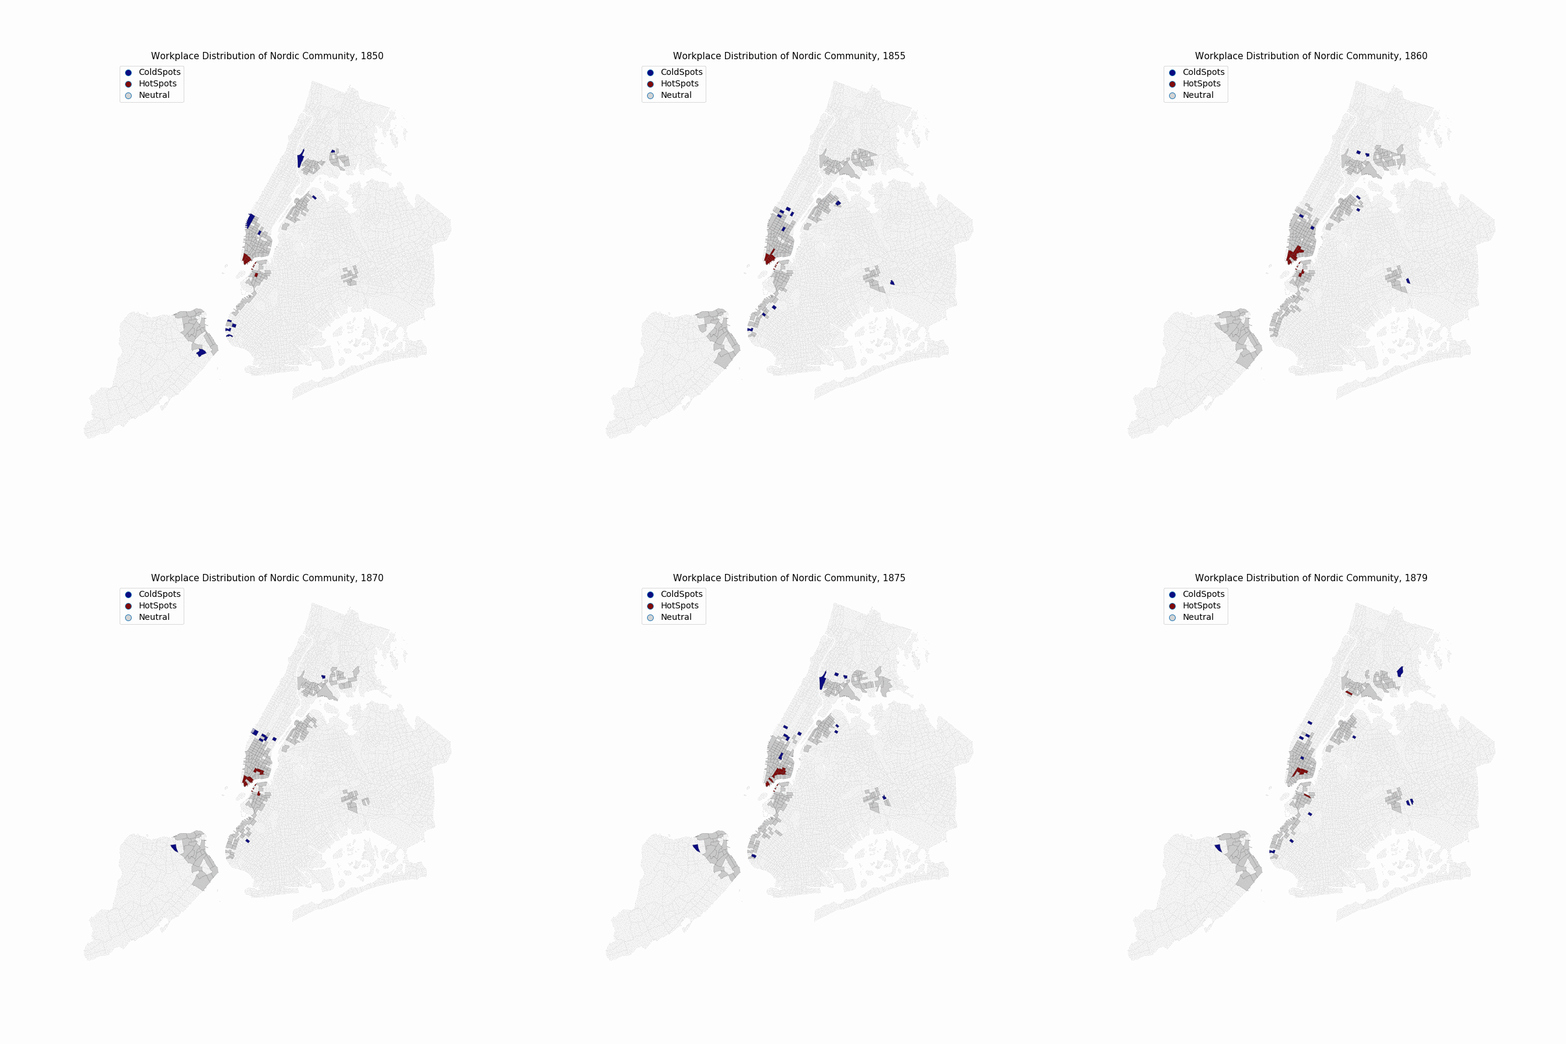
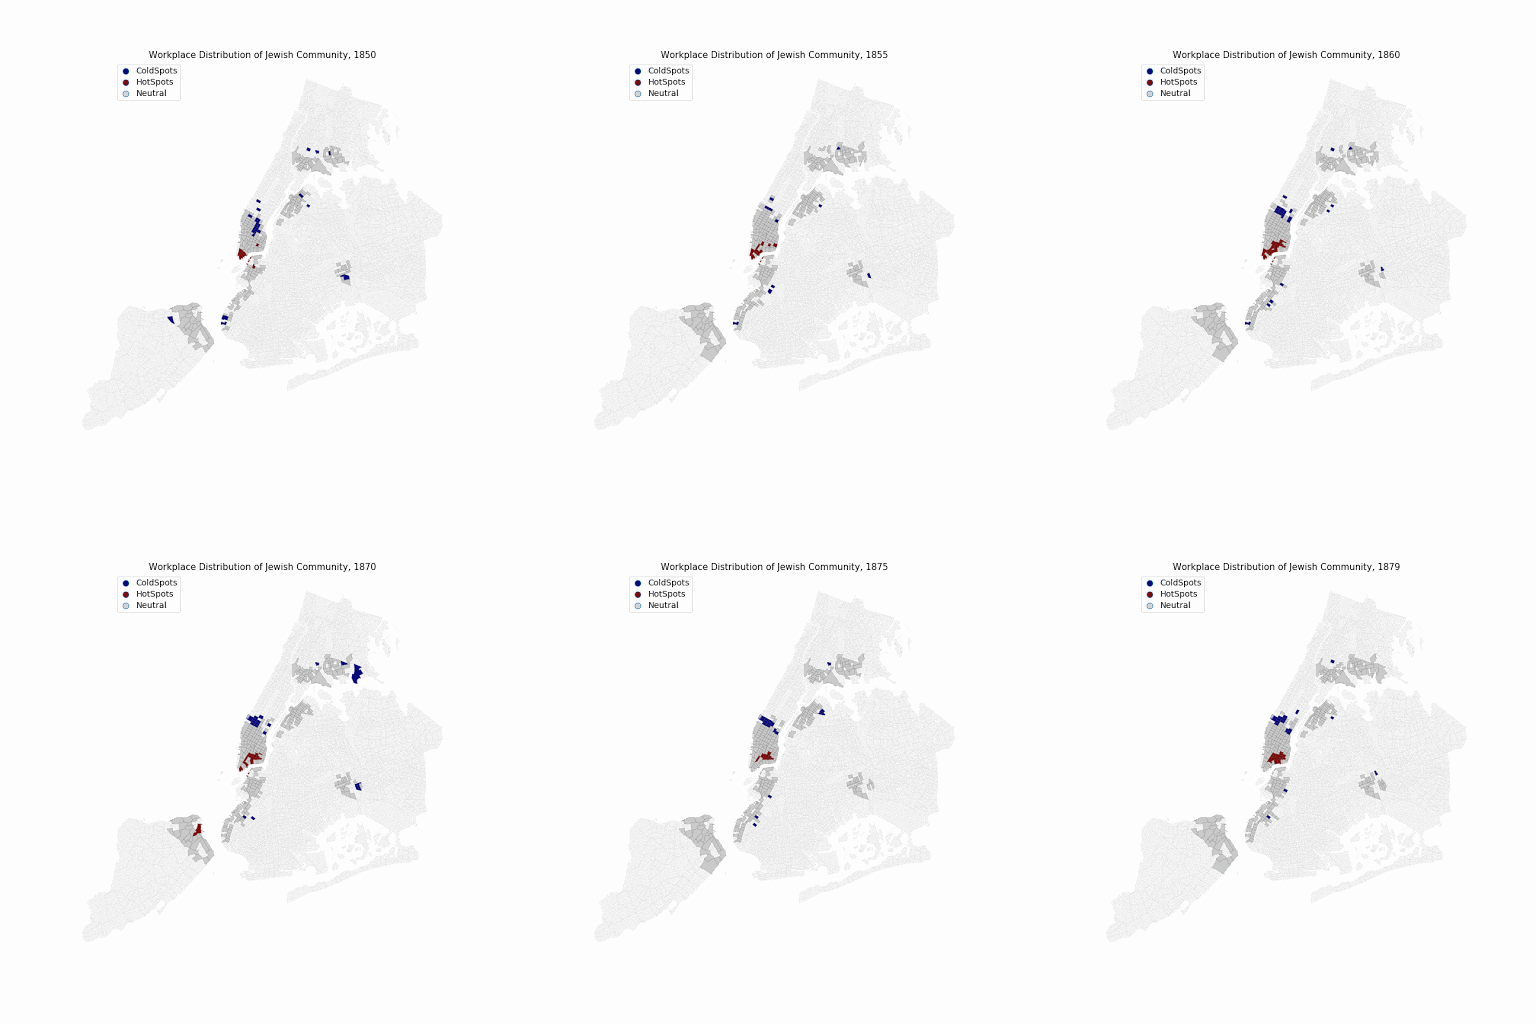
We used a local Moran’s I to identify hot and cold spots for the distribution of workplaces for the 5 most common ethnicities. Most businesses are, unsurprisingly, concentrated in the southern tip of Manhattan (today’s Financial District), though over the span of 30+ years we see shifts in where the majority of these businesses become centralized.

British
We observe a strong expansion within the Financial District, as well as growth into modern-day DUMBO. There is a prominent dearth of businesses in Midtown, which expands over time.

Germanic
Appears to be a concentration of jobs in Financial District, which migrates to the Lower East Side (LES) and South Queens. Heavy cold spot along coast of east Brooklyn, which disappears with time.

Nordic
Slow growth out of Financial District into LES, with cold spots in Midtown and
South Bronx.

Jewish
Hot spot originates in Financial District, condenses into large area of LES. Cold spots in Midtown and South Bronx that shrink with time.

French
Begins in Financial District, with slow expansion in to Northern Queens and South Bronx.
Most Common Female Occupations
Considering the gender tags assigned to each entry, we were interested in understanding the rise of the female workforce and observing what kinds of occupations were held by women. “Dressmaker” was consistently the largest percentage of jobs across the three decades (comprising approximately 30% of the job distribution, on average), with “Boarding House” and “Washing” surging in popularity, each claiming ~15% by the 1870s. “Milliner” shrinks considerably over time, while “Sewing” grows

Most Common Male Occupations
The top 10 male occupations remain rather consistent in their distribution over thirty years. We do see some shifts, however: “Grocer” shrinks in percentage, while “Clerk” expands. Quite interestingly, we find what we believe is simply a linguistic shift in what vehicle operators referred to themselves as: “Carman” is a prominent occupation in 1849 (nearly 20% of the male workforce), but is slowly replaced with “Driver”, which grows steadily in percentage year after year.
